In this second entry we are going to talk about the definition of mesh size in finite element models for structural analysis.
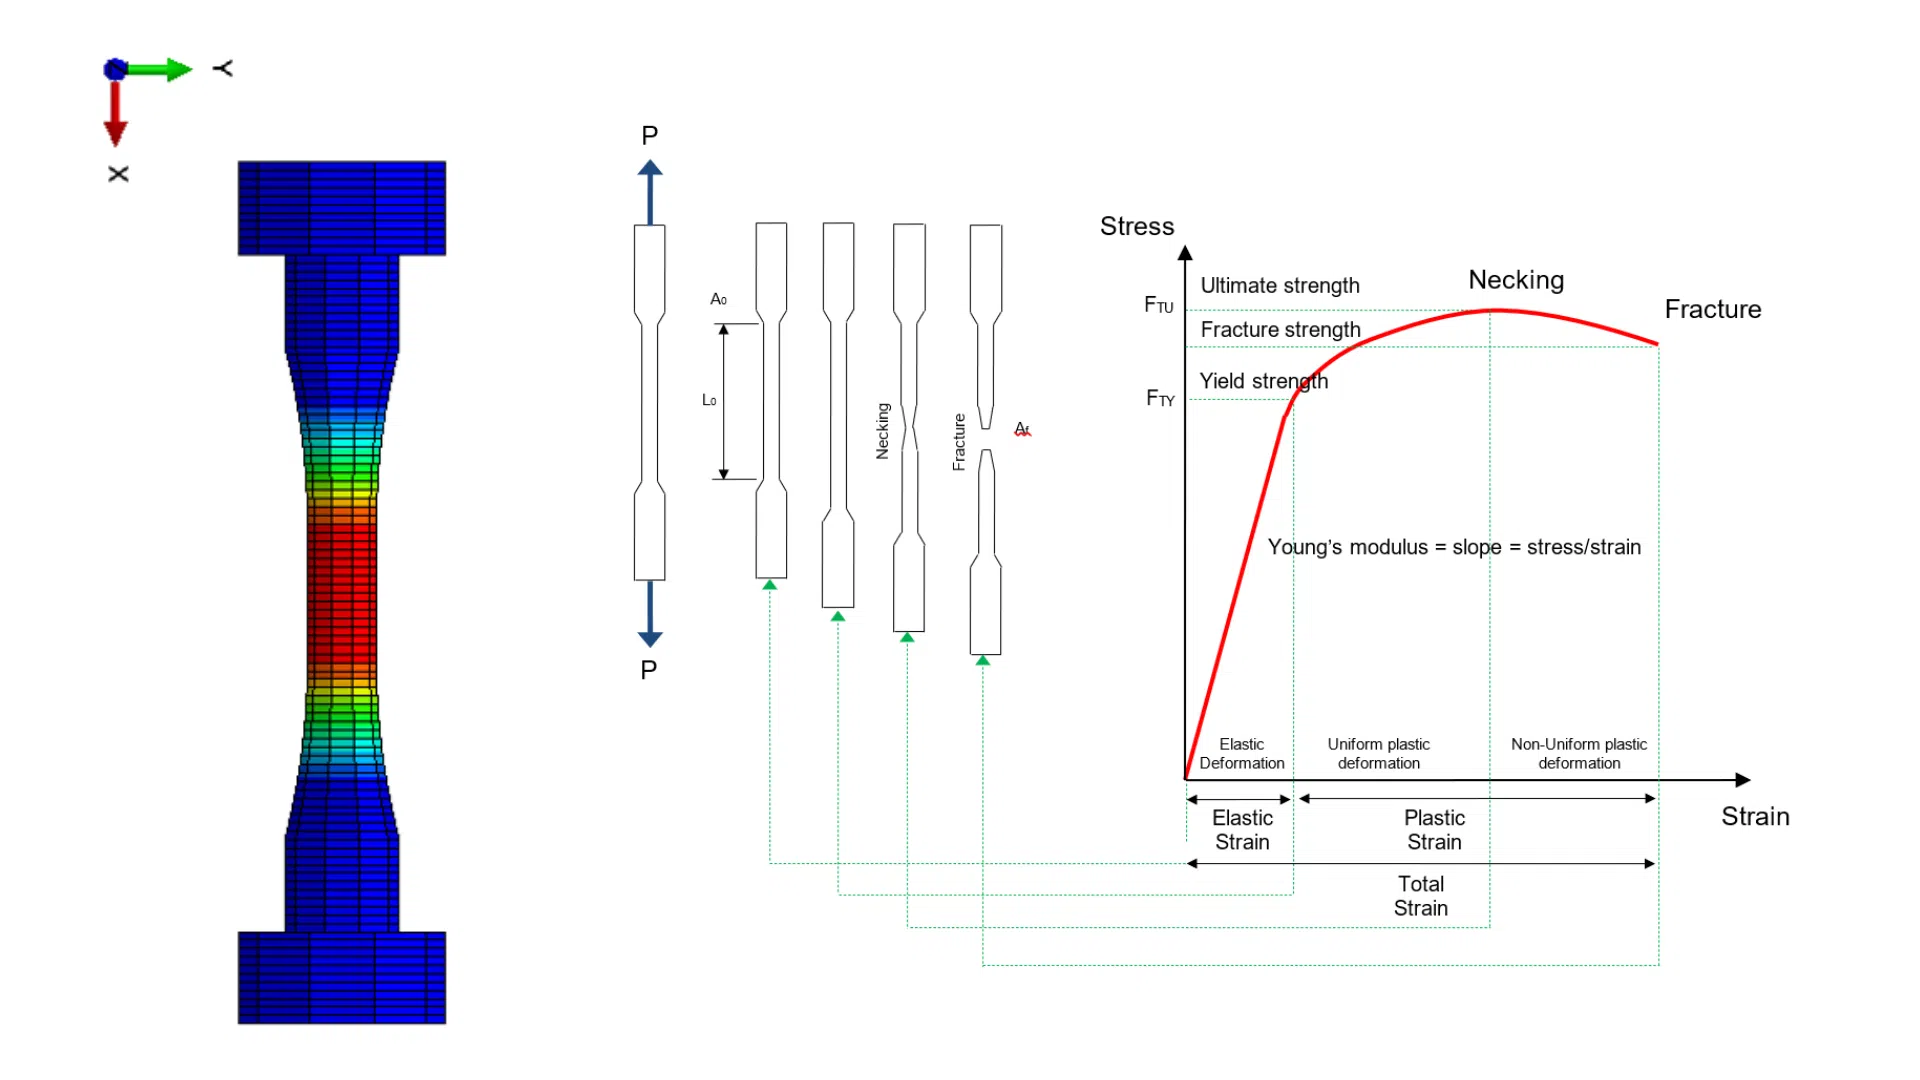
When we have our first contact with the method, generally in University Schools, the first thing we are taught is that the finite element method is an approximate method for solving partial differential equations, and that except for some types of elements, its accuracy increases with the greater discretisation of the problem, that is, by decreasing the size of the element and consequently increasing the number of elements in the model.
Thus, in order to minimise the error in the application of the method, it is usually proposed to carry out mesh convergence studies. However, in industrial and productivity environments, in many cases there is neither time nor resources to study the “perfect” mesh for the problem under study, and it is necessary to define previous mesh sizes that are valid for certain ranges of use.
Mesh size values in finite element models suitable for a wide range of structural engineering problems
In the following we will indicate those mesh size values in finite element models for structural analysis that are considered suitable for a wide range of structural engineering problems, both for static analysis (Ultimate Limit State and Serviceability Limit State) and fatigue analysis (stress concentration calculation, crack growth simulation with XFEM and obtaining the Stress Intensity Factor, SIF with XFEM or Contour Integral).
It should be noted that although the values presented here are valid for most of the scenarios we encounter when performing finite element models for structural analysis, for those components with high responsibility, complex geometry and high stress gradients, it will be necessary to perform a mesh convergence study in order to obtain sufficiently accurate results, as well as to use post-processing techniques using dummy elements to capture more accurately the stresses at edges and free surfaces.
Buckling analysis
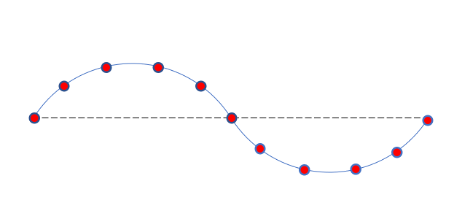
- ≥ 5 elements per half-wave of the desired buckling mode to be obtained and represented
Buckling analysis of beams:
- ≥ 3 elements in beam flanges
- ≥ 5 elements in beam webs
Bolted joints:
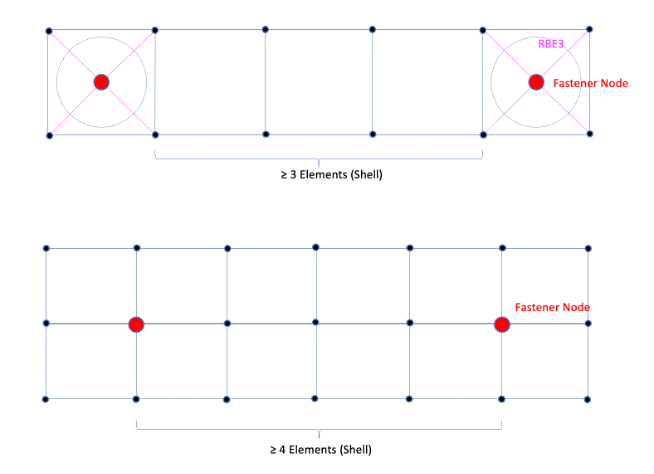
- General rule: ≥ 3 elements between rivets
- Recommendation: if the section forces between rivets is to be assessed, ≥ 6 elements between rivets is recommended.
- The following image shows the “usual” modelling in detail models in the aeronautics sector
Plates modelled as 3D parts:
- First order elements: minimum of 4 elements through thickness
- Second order elements: minimum of 2-3 elements through thickness
- “CONTINUUM SHELL – Abaqus: 1 element through thickness
Mesh transitions:
- Mesh transitions should always be made away from the study area.
- Mesh transitions with linear triangular plate elements or linear tetrahedrons elements should be avoided as far as possible, as they cause local stiffness increase.
Stress discontinuities:
As mentioned above, stress values are discontinuous between contiguous elements. This level of discontinuity of stresses between an element and contiguous elements is a measure of the accuracy of the results obtained at that point. The following accuracy ranges can be considered in detail and semi-detail models:
- Very accurate: If the stress difference between an element and its neighbours is less than 5%. This configuration is to be used for fatigue analysis primarily
- Accurate: if the difference is between 5% and 10% . Valid configuration for static analysis on components subjected to high mechanical stresses (close to the limit stress of the material Fty)
- Medium: if the difference is between 10% and 20%. Valid configuration for static analysis on components subjected to low mechanical stresses
- Coarse: greater than 20%. Not valid for stress assessment directly on the component. The model should only be used for the evaluation of forces in sections and subsequent analytical post-processing to obtain the stress state of the component
Fillet radius (fatigue analysis):
- 8 elements for every 90°
Contacts:
- Mesh size of the slave surface less than or equal to that of the master surface
XFEM (Abaqus) Crack Growth for high cycle fatigue:
- Through crack: the optimum element size in the rupture zone should be = 0.25 mm (model units [N, mm]).
- Surface crack: the optimum element size in the crack zone should be ≤ 0.25 mm (model units [N, mm]).
Calculation of the Stress Intensity Factor – SIF with Abaqus code
- XFEM: use this method for preliminary analysis only. The results obtained are less accurate than those obtained with the J-contour Integral:
- Maximum mesh size = 0.25 mm (model units [N, mm])
- Number of contours to be evaluated = 5-10.
- In all analyses, contours that are at 1⁄3 Renrich of the crack tip have been discarded.
- Renrich = 3 times the size of the element in the enrichment zone
- Use of non-reduced linear elements: C3D8
- J Integral
- Maximum mesh size = 0.25 mm for surface and corner cracks (units of the model [N, mm])
- Number of contours to be evaluated = 5
- Element type:
- 2D quadratic elements
- 3D linear or quadratic elements